Slow query report
This document defines our generic analytic Slow requests report that allows users to focus on response time and monitor the performance of their app requests. This report is designed to provide you with the important details about the problematic and slowest requests that have occurred in your application starting from 00:00 UTC of the current day. In this manner, you get a clear idea of the exact moment the unhandled request occurred. You can also ascertain parameters associated with the request as method and path, response status and response time (in milliseconds).
This report is exceptionally advantageous for developers as it helps them understand the precise cause of slow requests and eliminate the bottlenecks by identifying inefficient and expensive queries, thereby enabling them to improve app performance.
This Analytic Report will work only if the Parse Server version of your app is equal to or greater than 2.8.4.
If you want to manage your Parse Server Version for 2.8.4, follow these instructions.
To start using the Slow requests report of your app, you need to:
- Go to Back4App Website and click on My Apps. Find your app and then click on DASHBOARD.2. Select More > Analytics section and click on Slow Requests section under the Analytics tab.
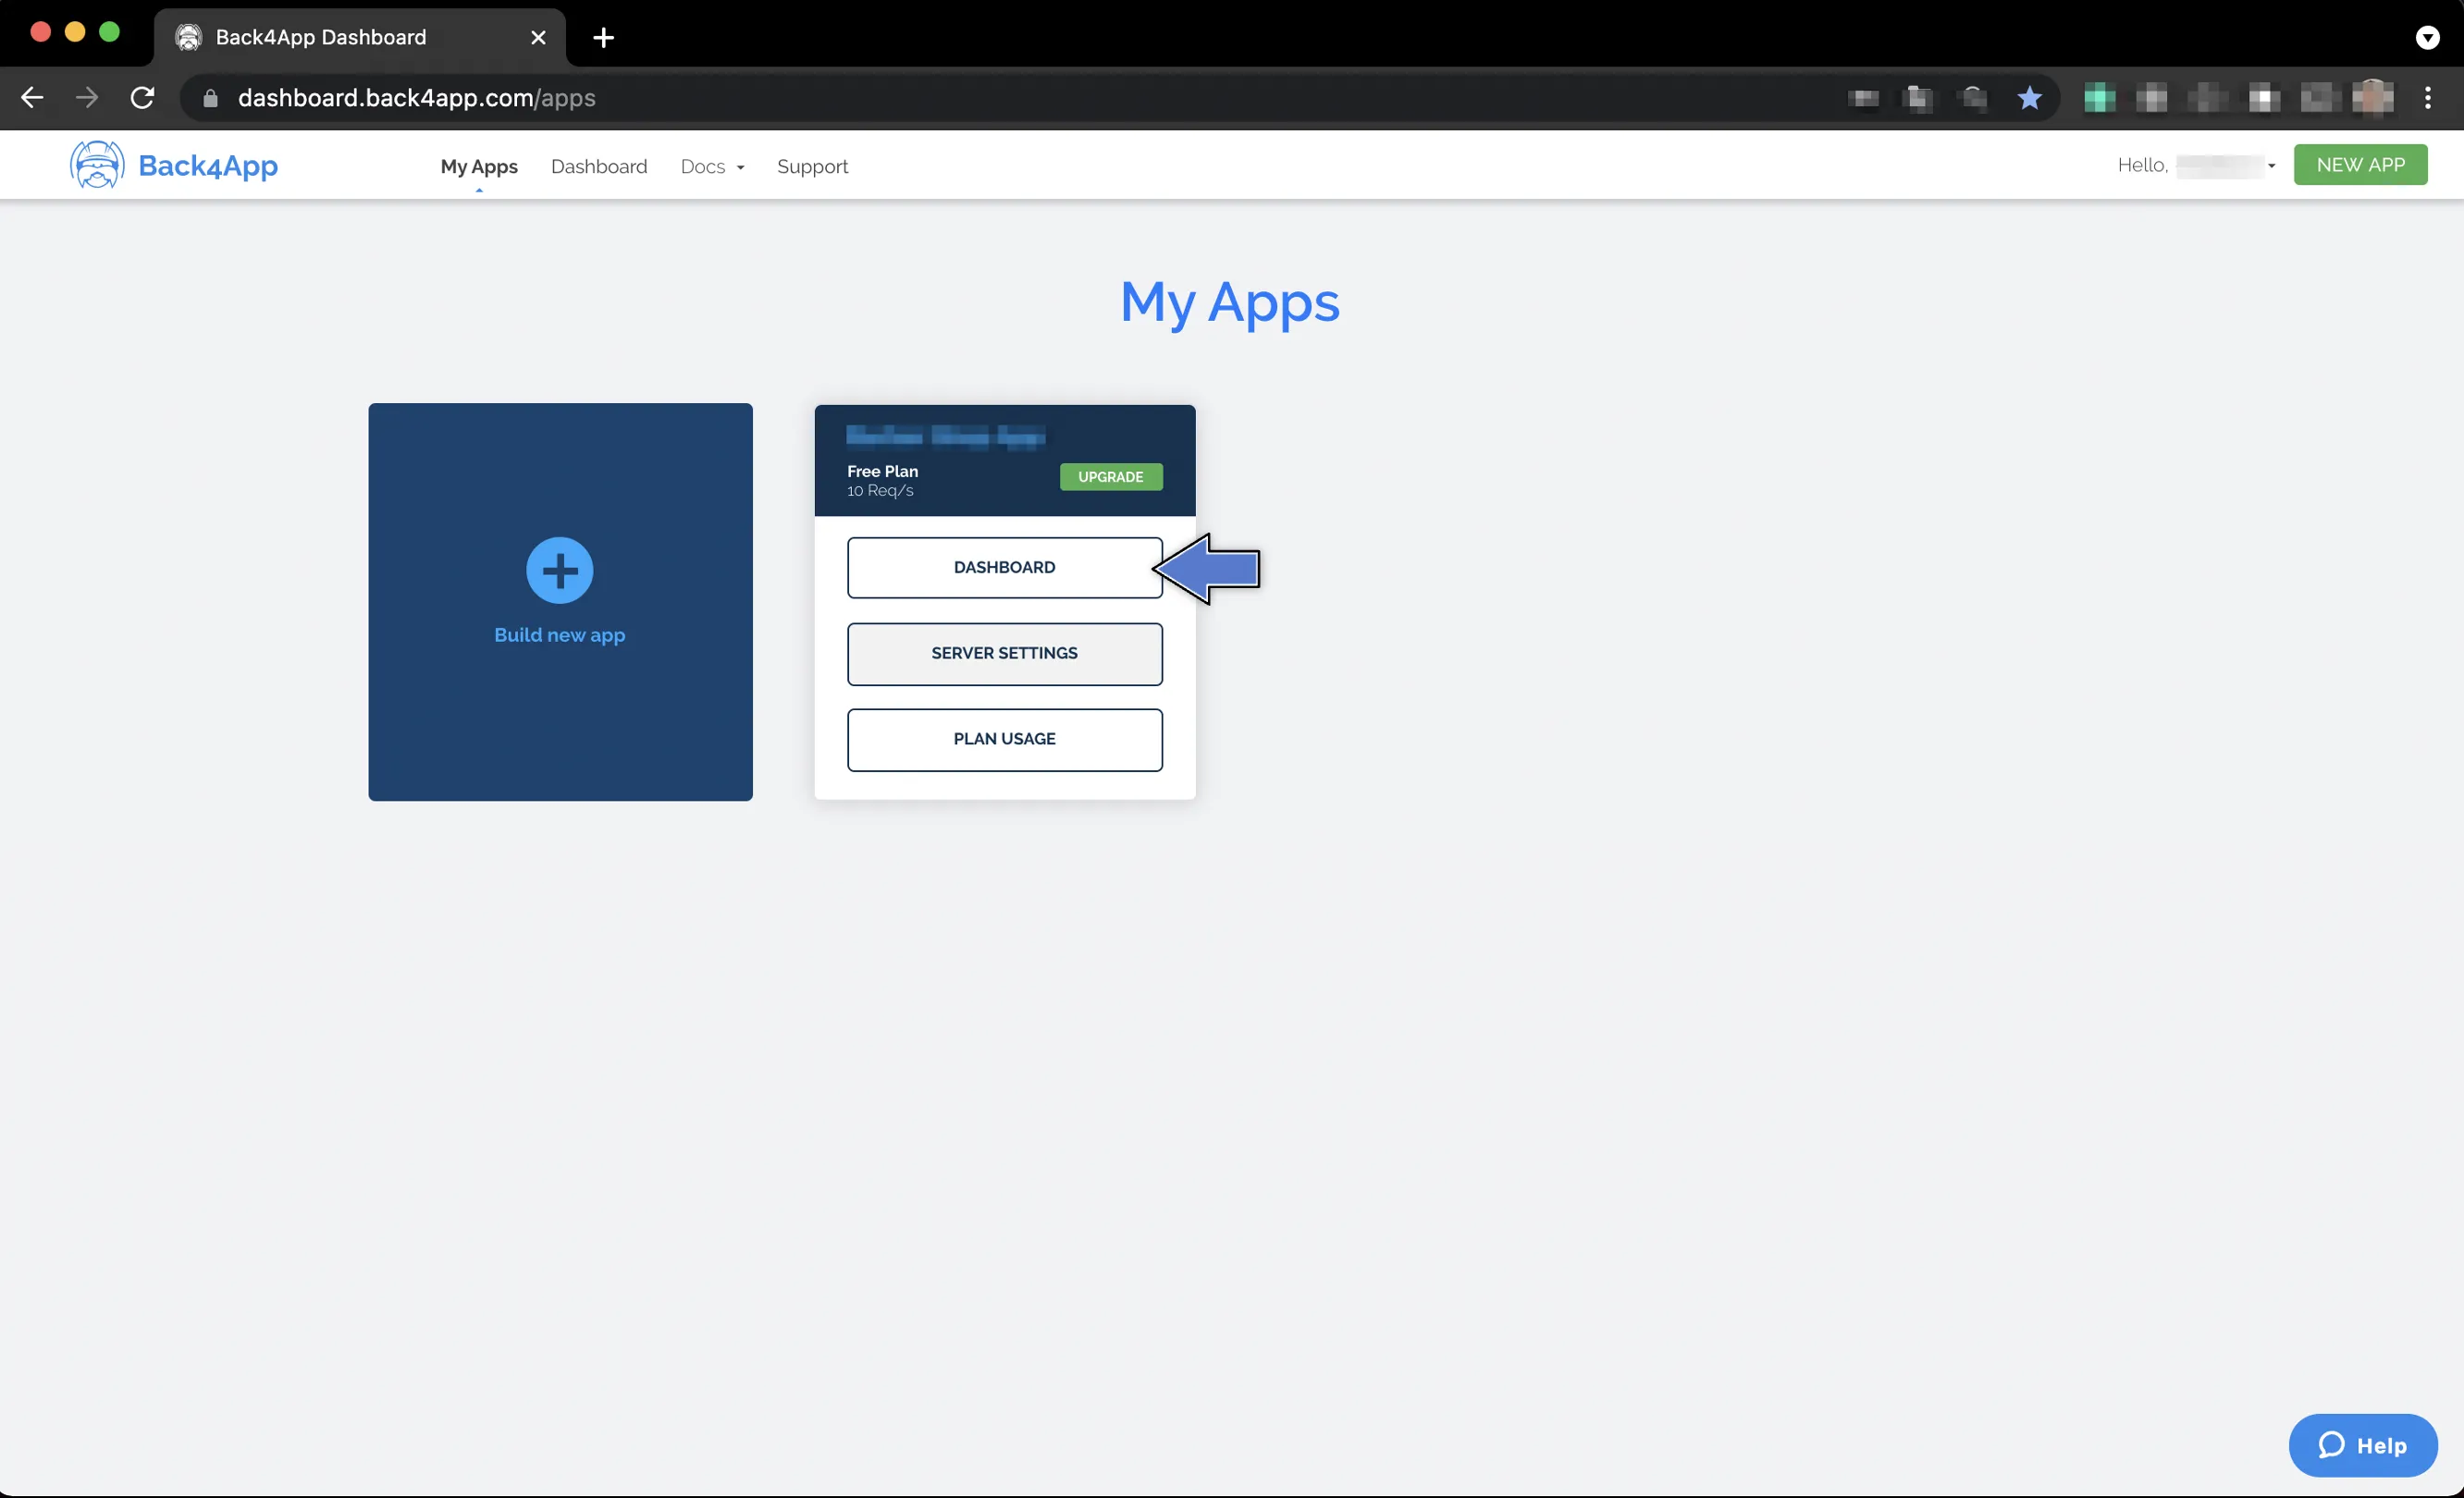
2. Select More > Analytics section and click on Slow Requests section under the Analytics tab.
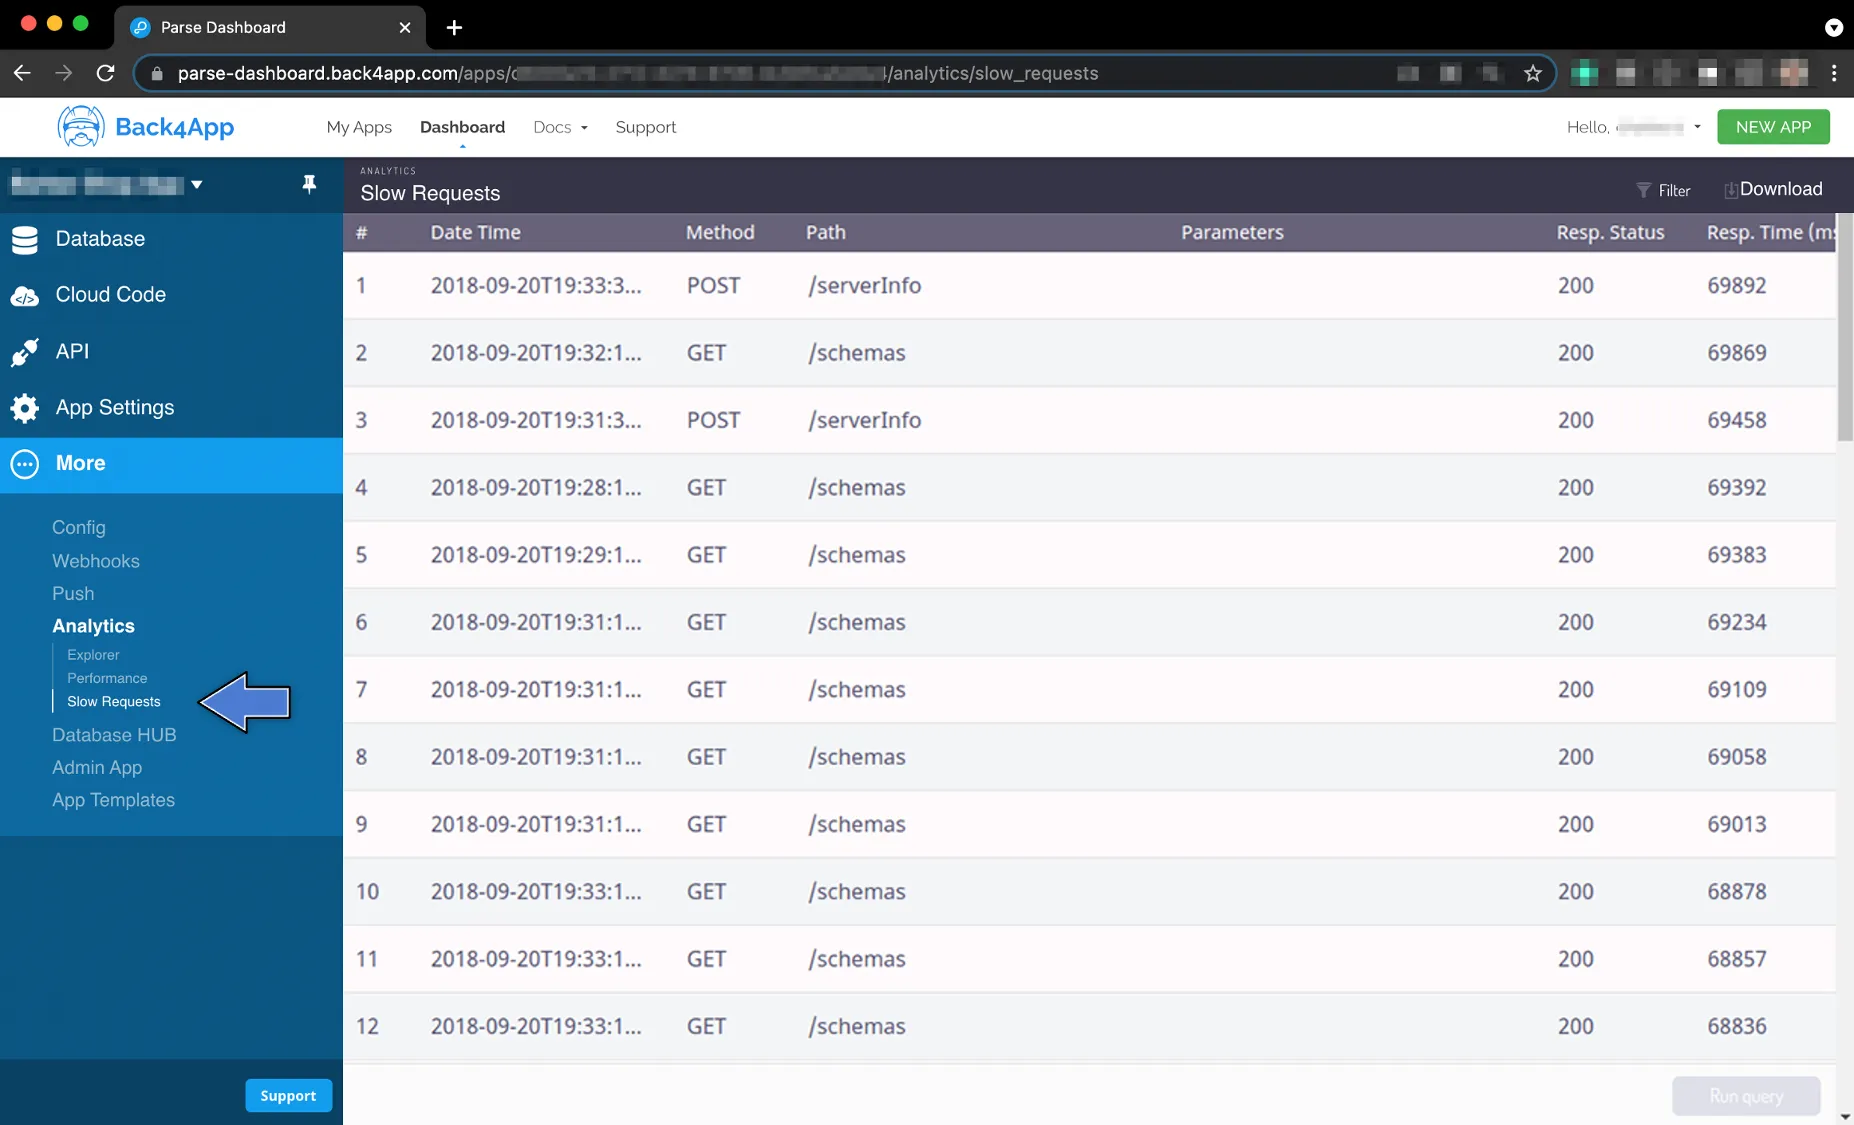
By now, you should be seeing a list on the right side of the Dashboard containing the slowest requests that have occurred in your app, starting from 00:00 UTC of the current day. This list will show all the vital information about the slow requests, including the exact date and time the request has occurred, its method and path, parameters associated with it, its response status, and also response time in milliseconds.
The list comprising slow requests is arranged from the request with the longest response time to the one with the shortest response time.
To see all the entries of the list, scroll down a little bit.
To explore the Slow requests report of your app, follow these steps:
- If you don’t want to see all slow requests in the list at once, you can filter the necessary queries that are required in the report. To do so, you need to click on the Filterbutton located at the top right corner.
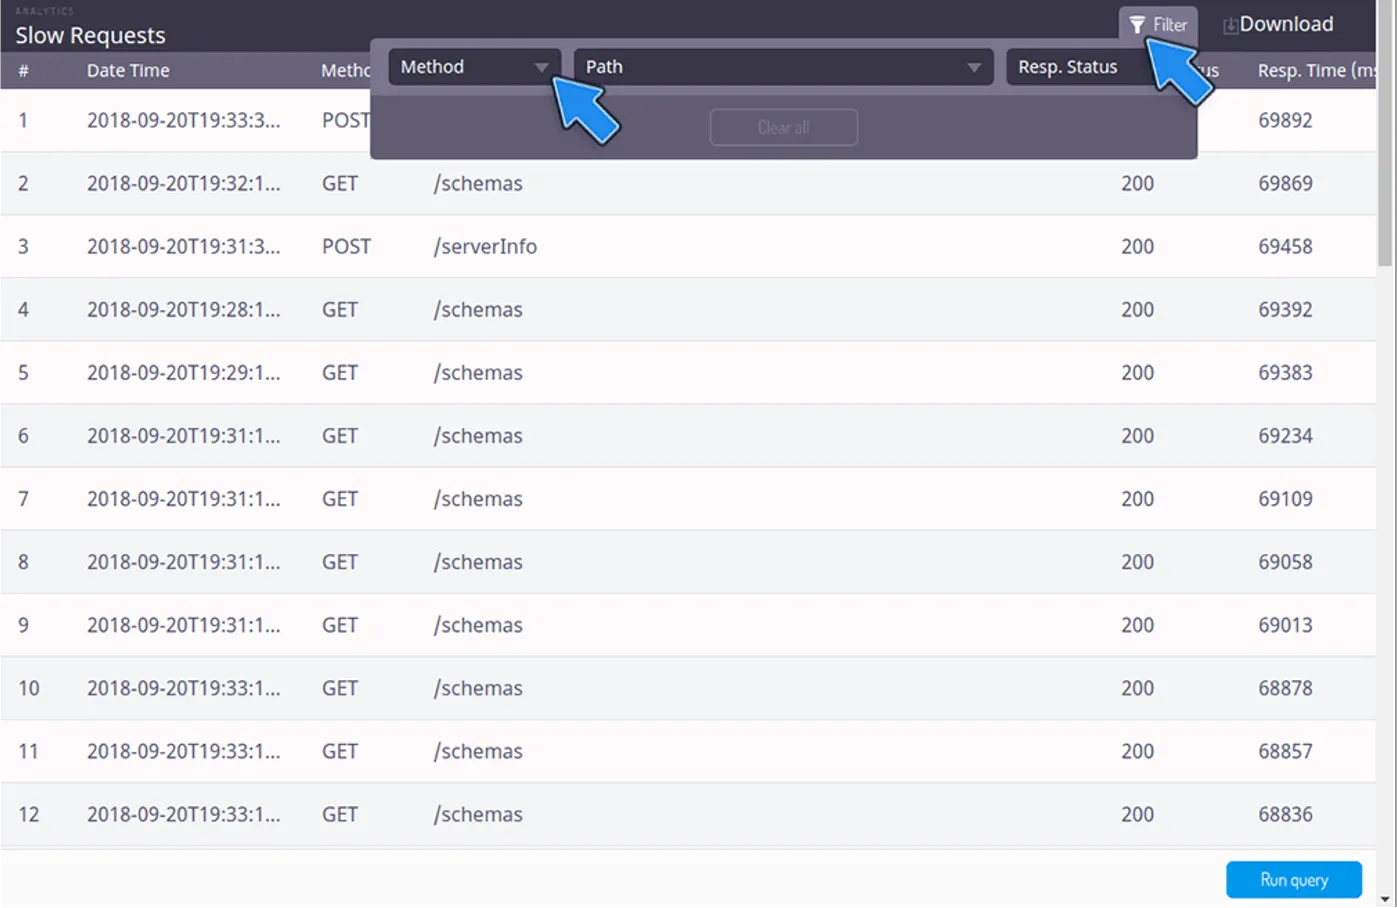
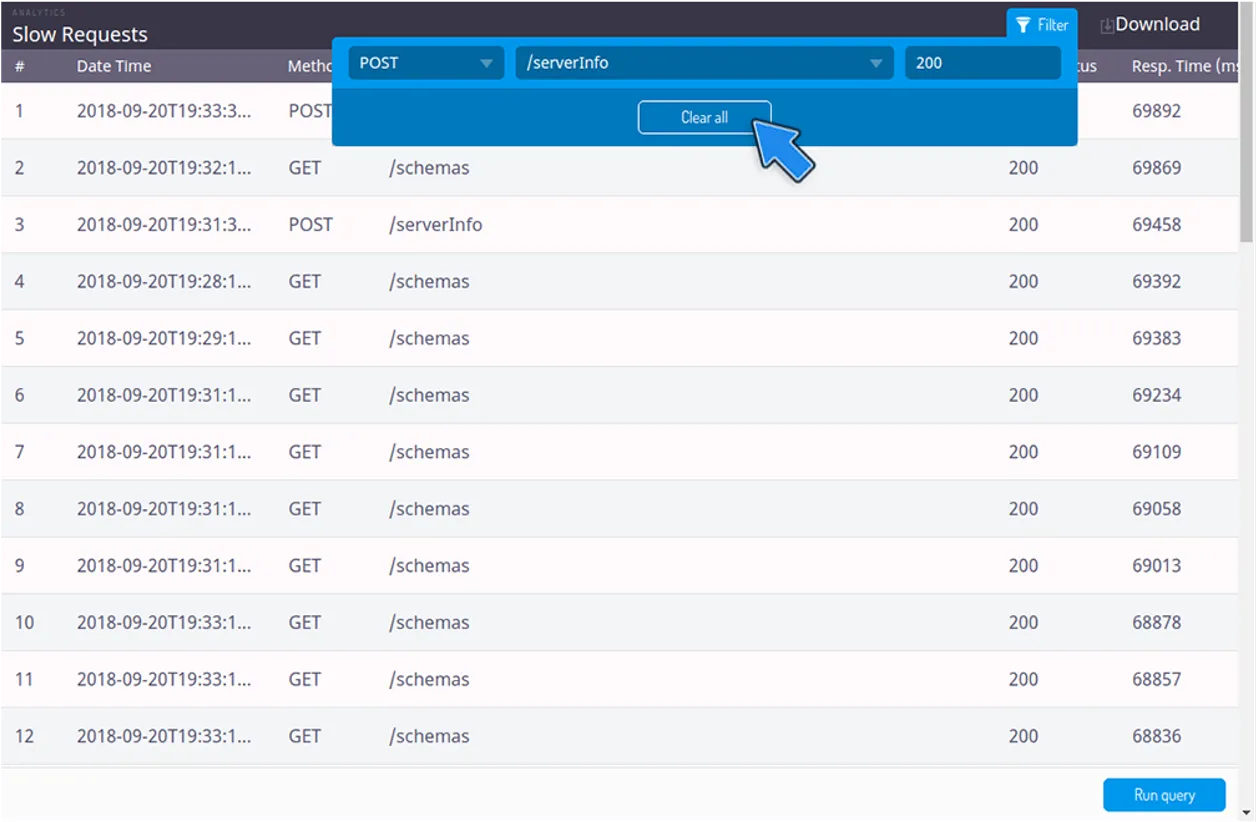
2. Select the filter you want to apply: Method, Path, or Response Status of your slow requests. On selecting one of the filters, you can already run a query. You can also pick multiple filter items from the options . After choosing the filter (or filters) you want, go to the bottom right corner of your Dashboard and click on the Run query button.
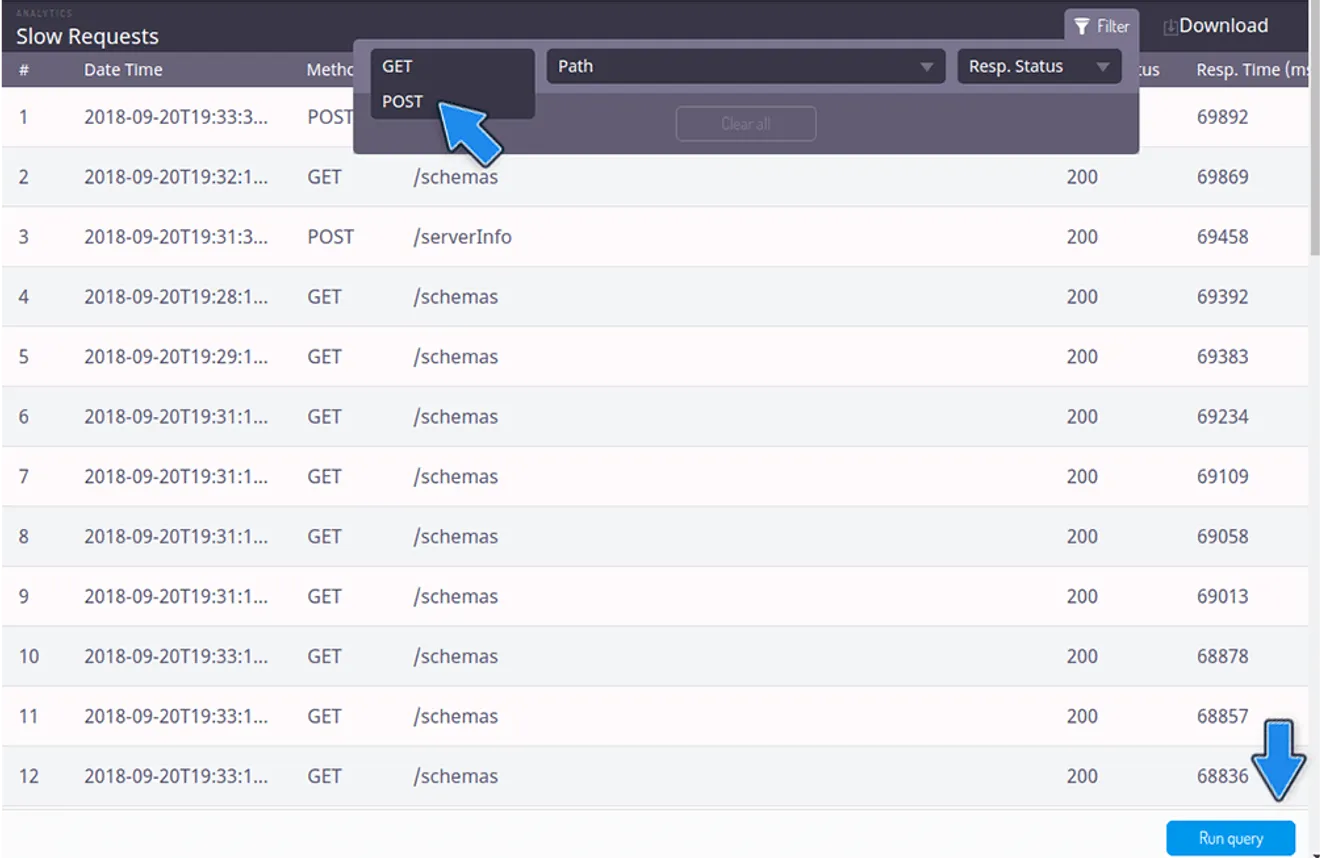
Be aware that if you select a new filter, you can’t undo this selection, except if you click on Clear all. This option will automatically clear all your filter selections.
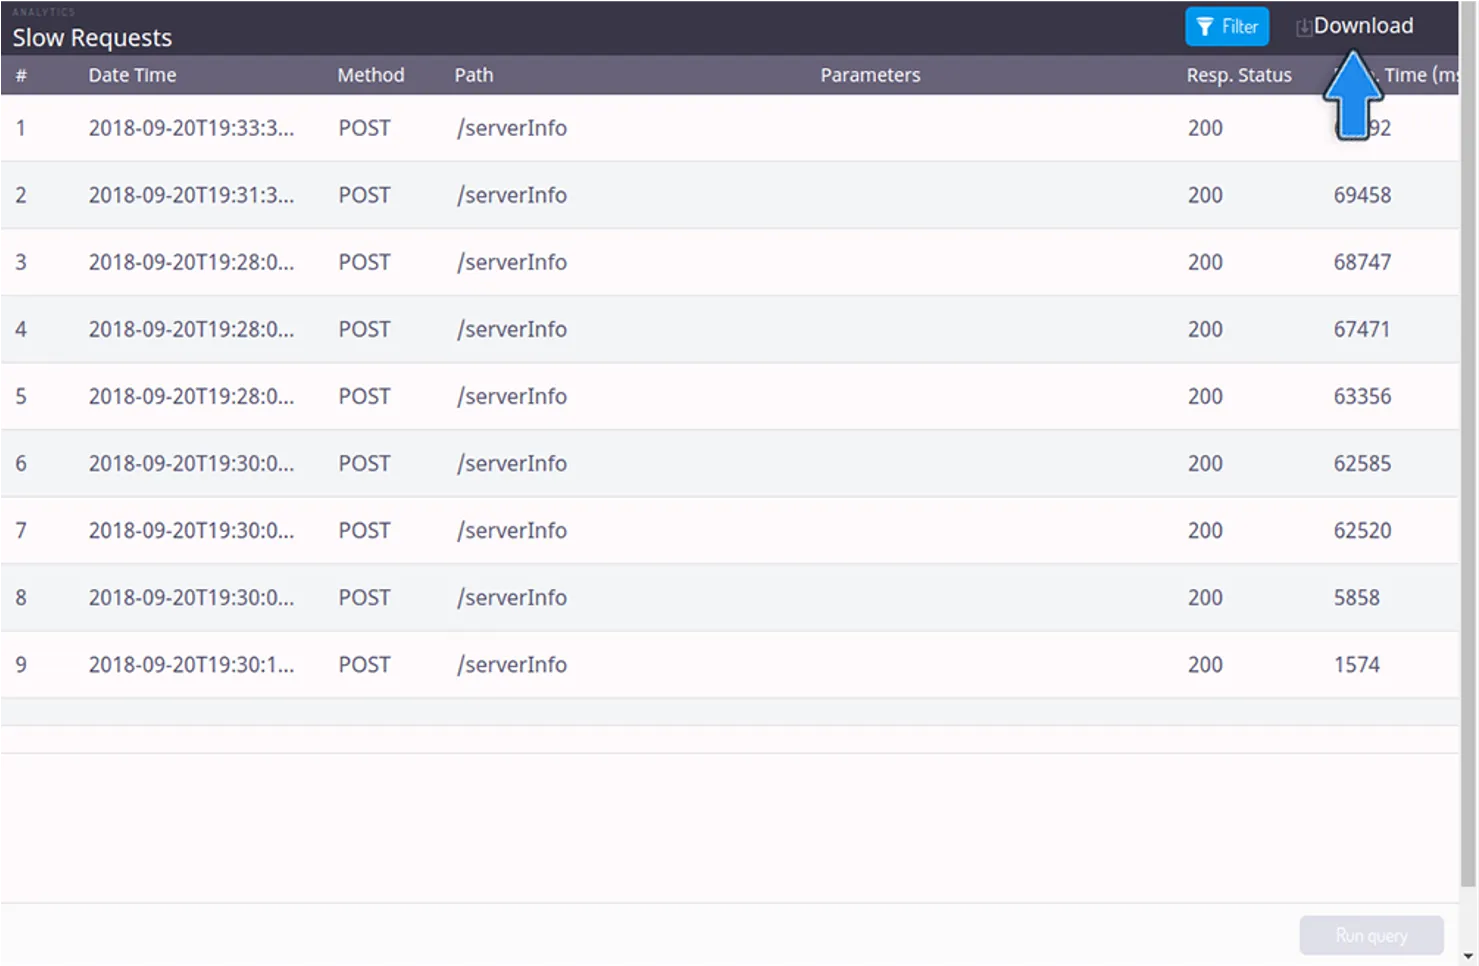
3. Now, your filtered query is done, as shown in the image below.

4. If you want to download the report data, click on the Download button placed on the top right of the screen.
Congratulations! Now, you can explore the Slow requests report of your app through Back4App and identify as well as optimize slow requests!